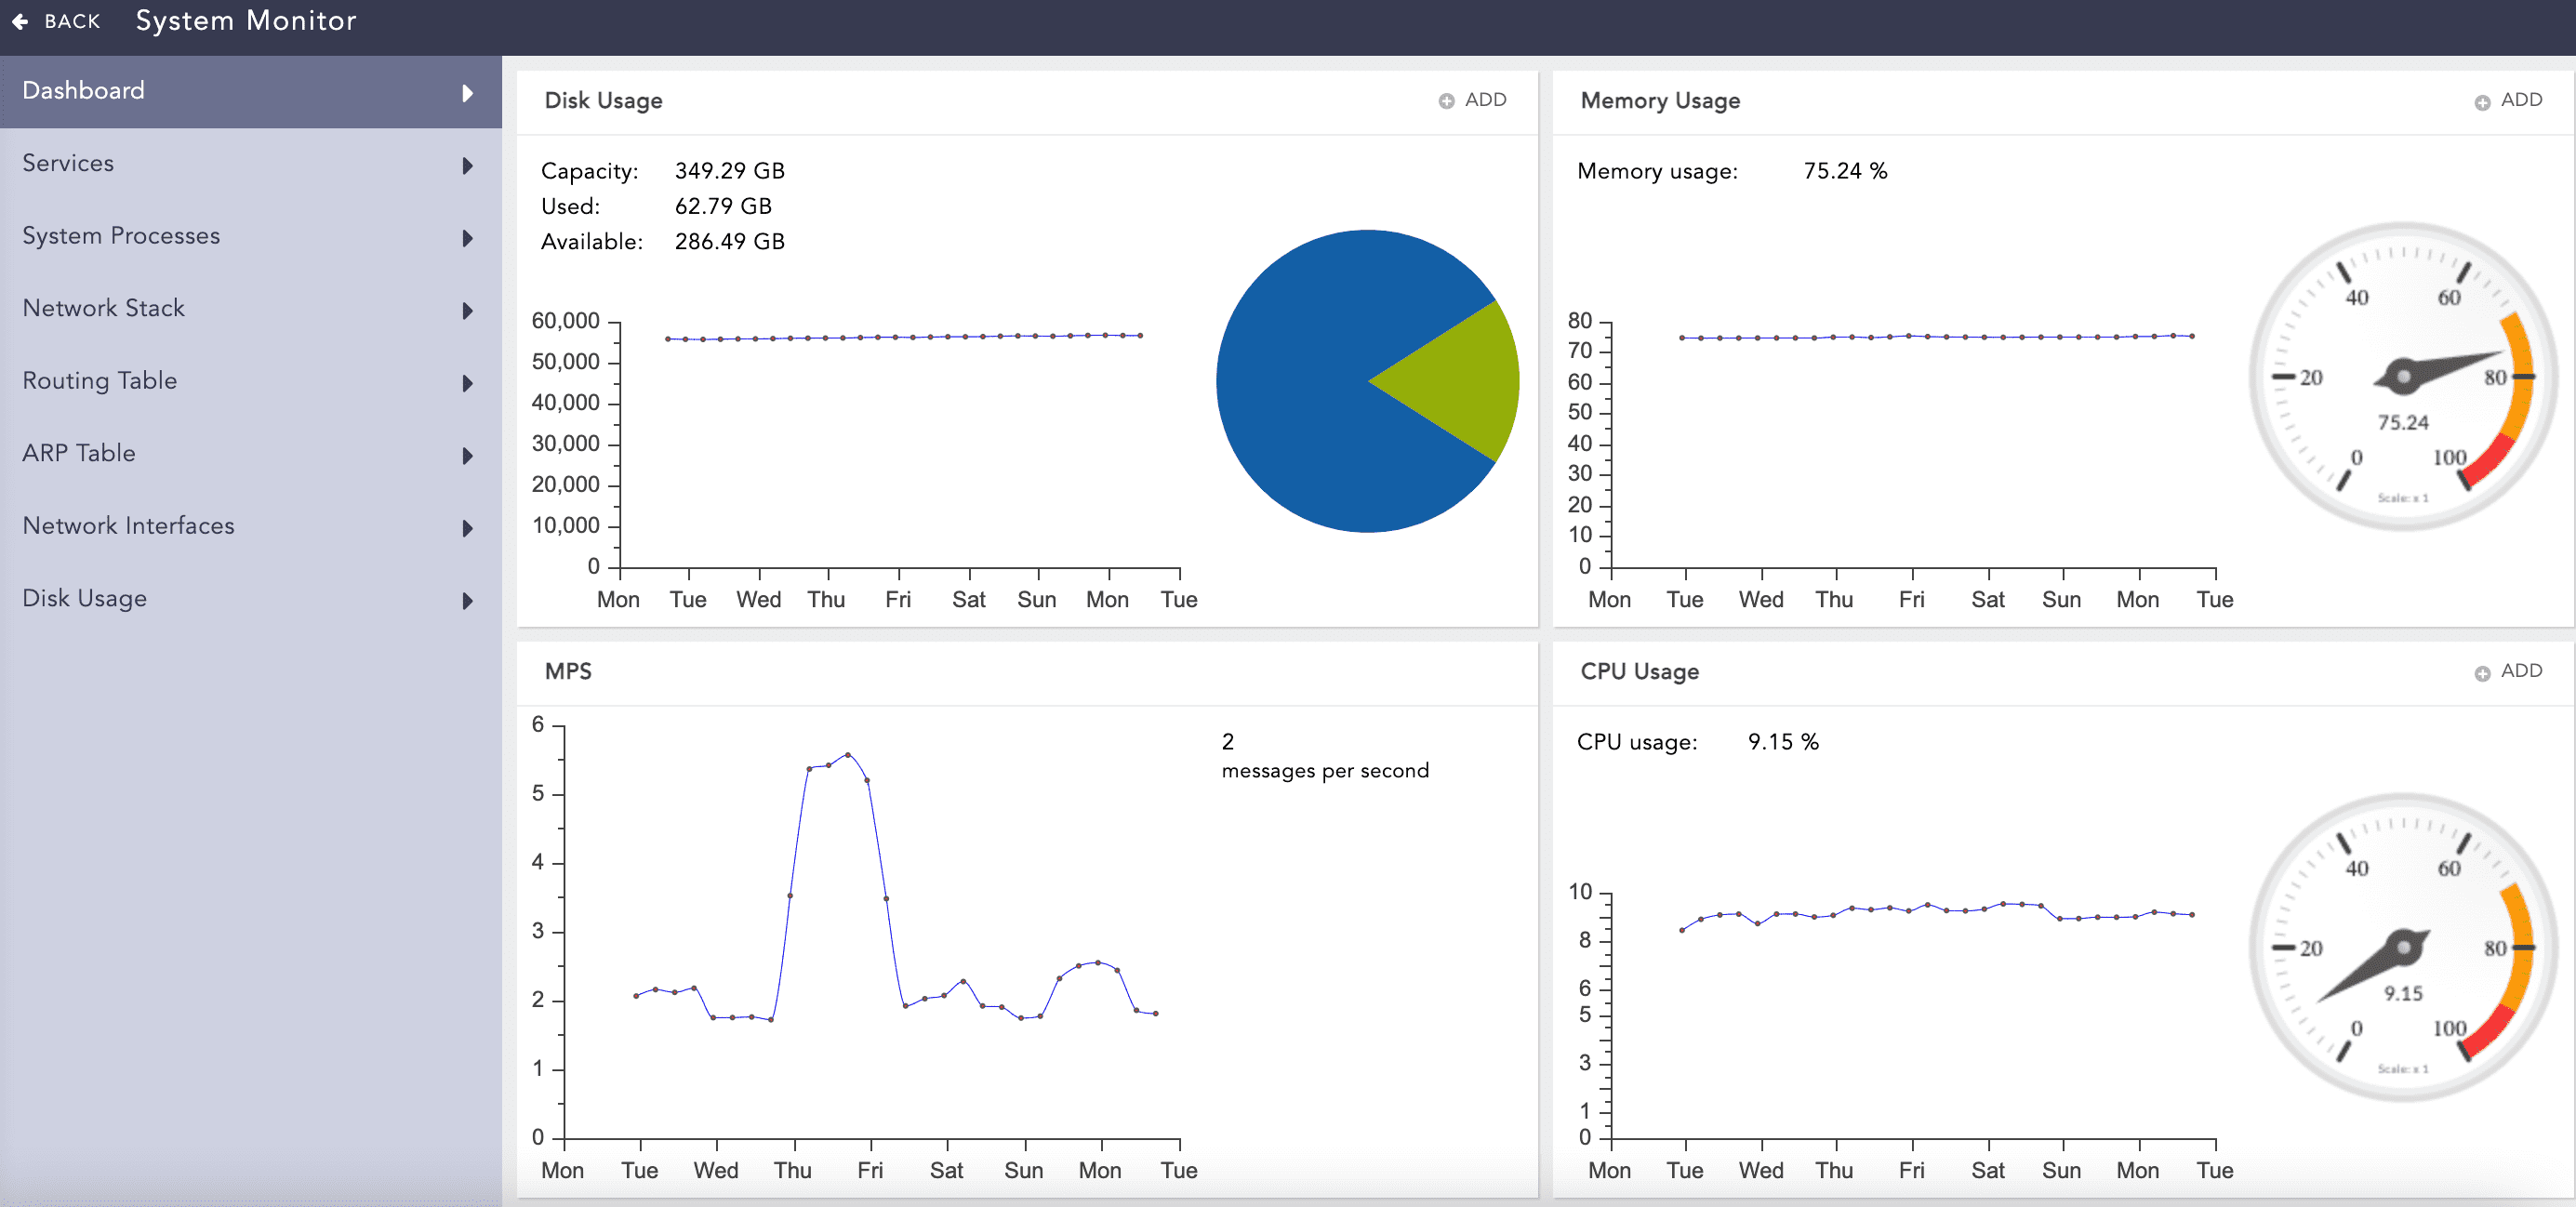
The System Monitor dashboard contains widgets displaying different components of the system’s status. You can navigate through the menu to view the status of Dashboard, Services, System Processes, Network Stack, Routing Table, ARP Table, Network Interfaces and Disk Usage.
System Monitor
The dashboard displays the current status of different components of the system.
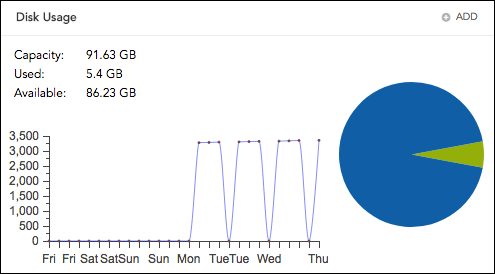
Disk Usage
Shows total disk usage by the LogPoint file systems. It displays the total capacity, used and available disk space, and disk usage of the system.
Disk Usage
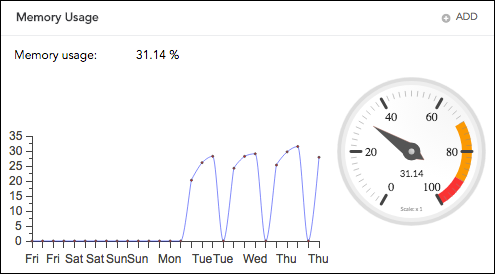
Memory Usage
Displays the total memory usage by the systems.
Memory Usage
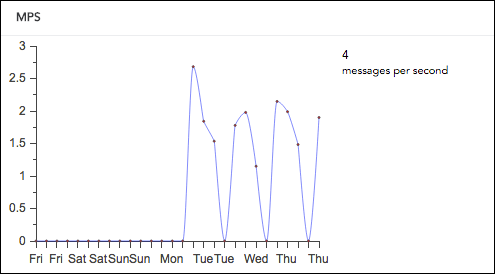
Message Per Second (MPS)
Displays the total message or events processed per second by the system. LogPoint has its own Object Identifier (OID) to measure the MPS via SNMP.
Message Per Second
CPU Usage
Displays the total CPU usage by the systems. However, a delay of at most five minutes can exist in the chart’s results.
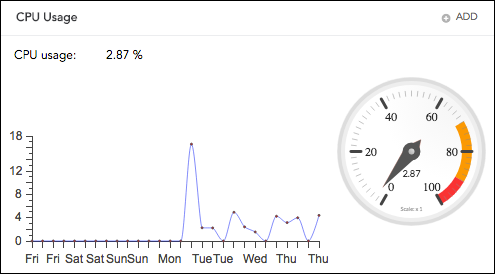
CPU Usage
Note
The Disk Notification, CPU Notification and Memory Notification can be configured by clicking the Add icon of the corresponding notifications.
It lists all service applications running in LogPoint. You can view the status of applications and stop, start, or restart the services.
Starting Services
To initiate a service, click the Start Service icon from the Actions column of the service.
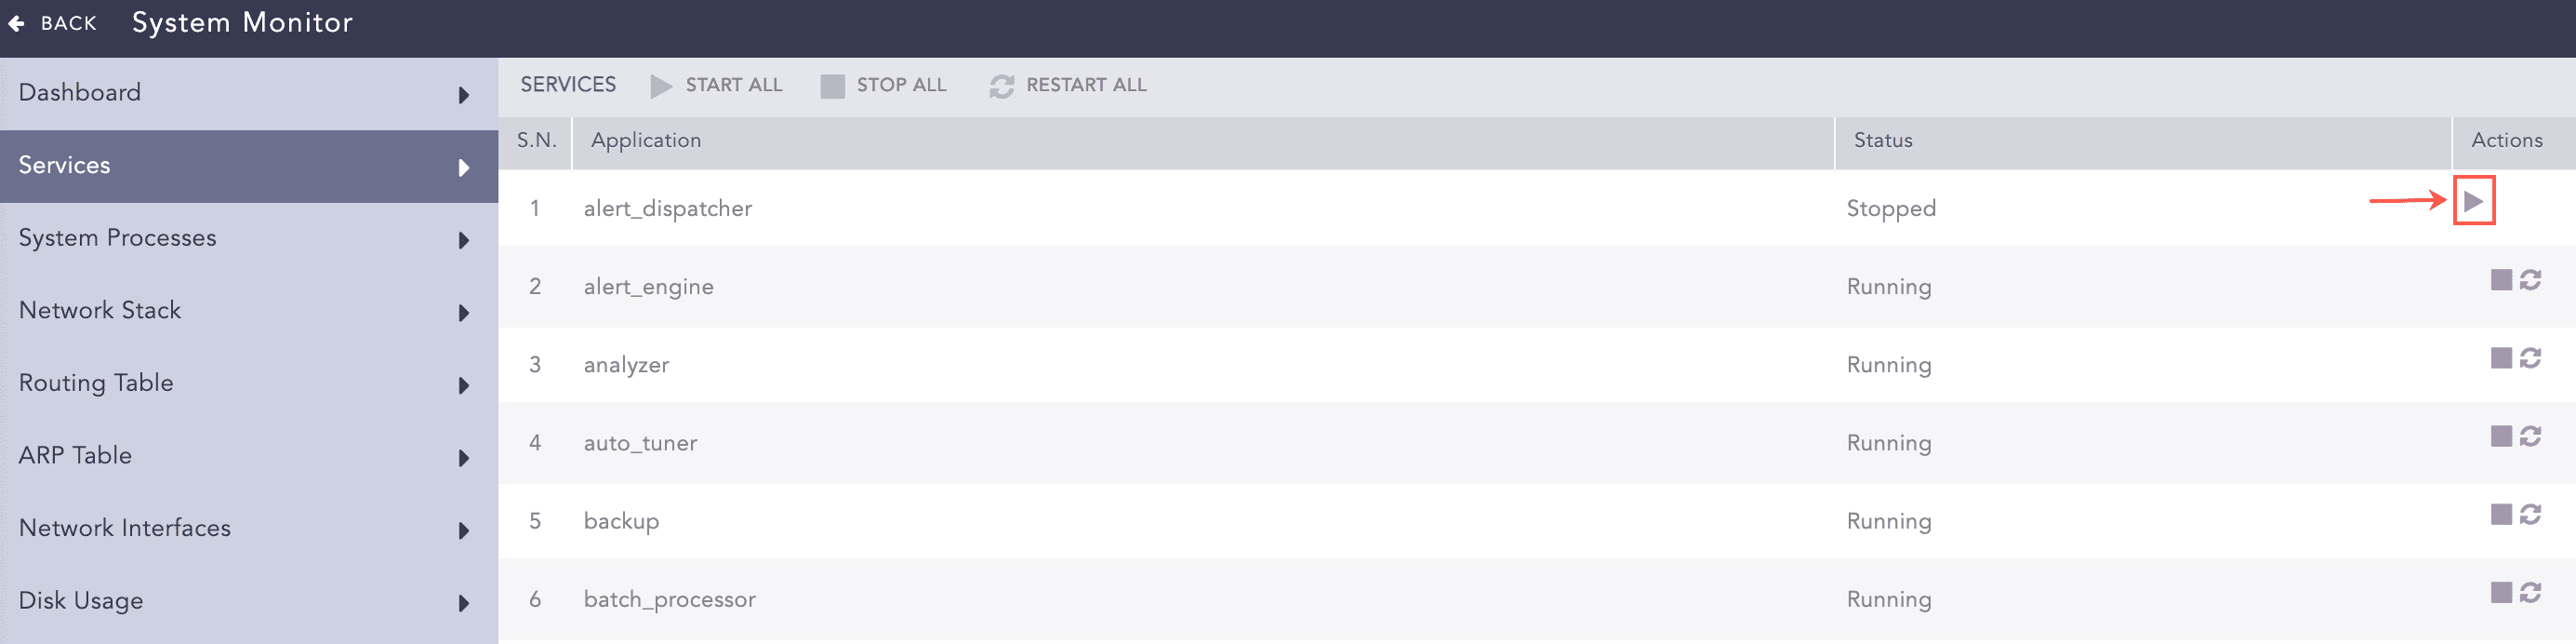
Services
To start all the services, click Start All.
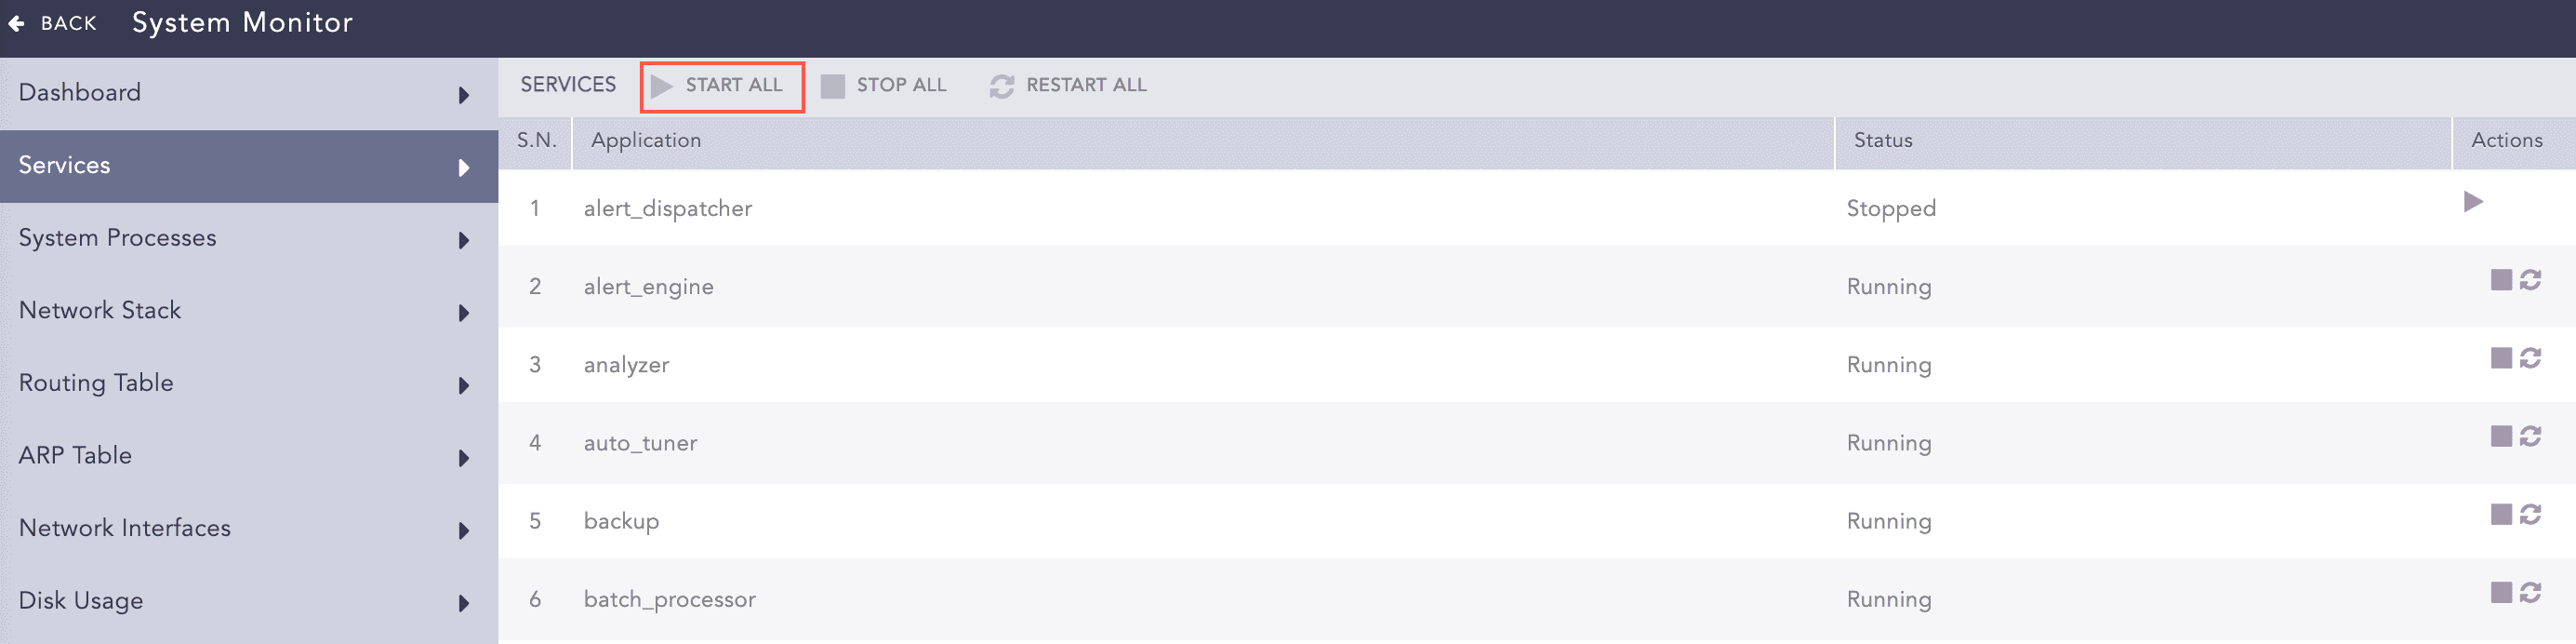
Services
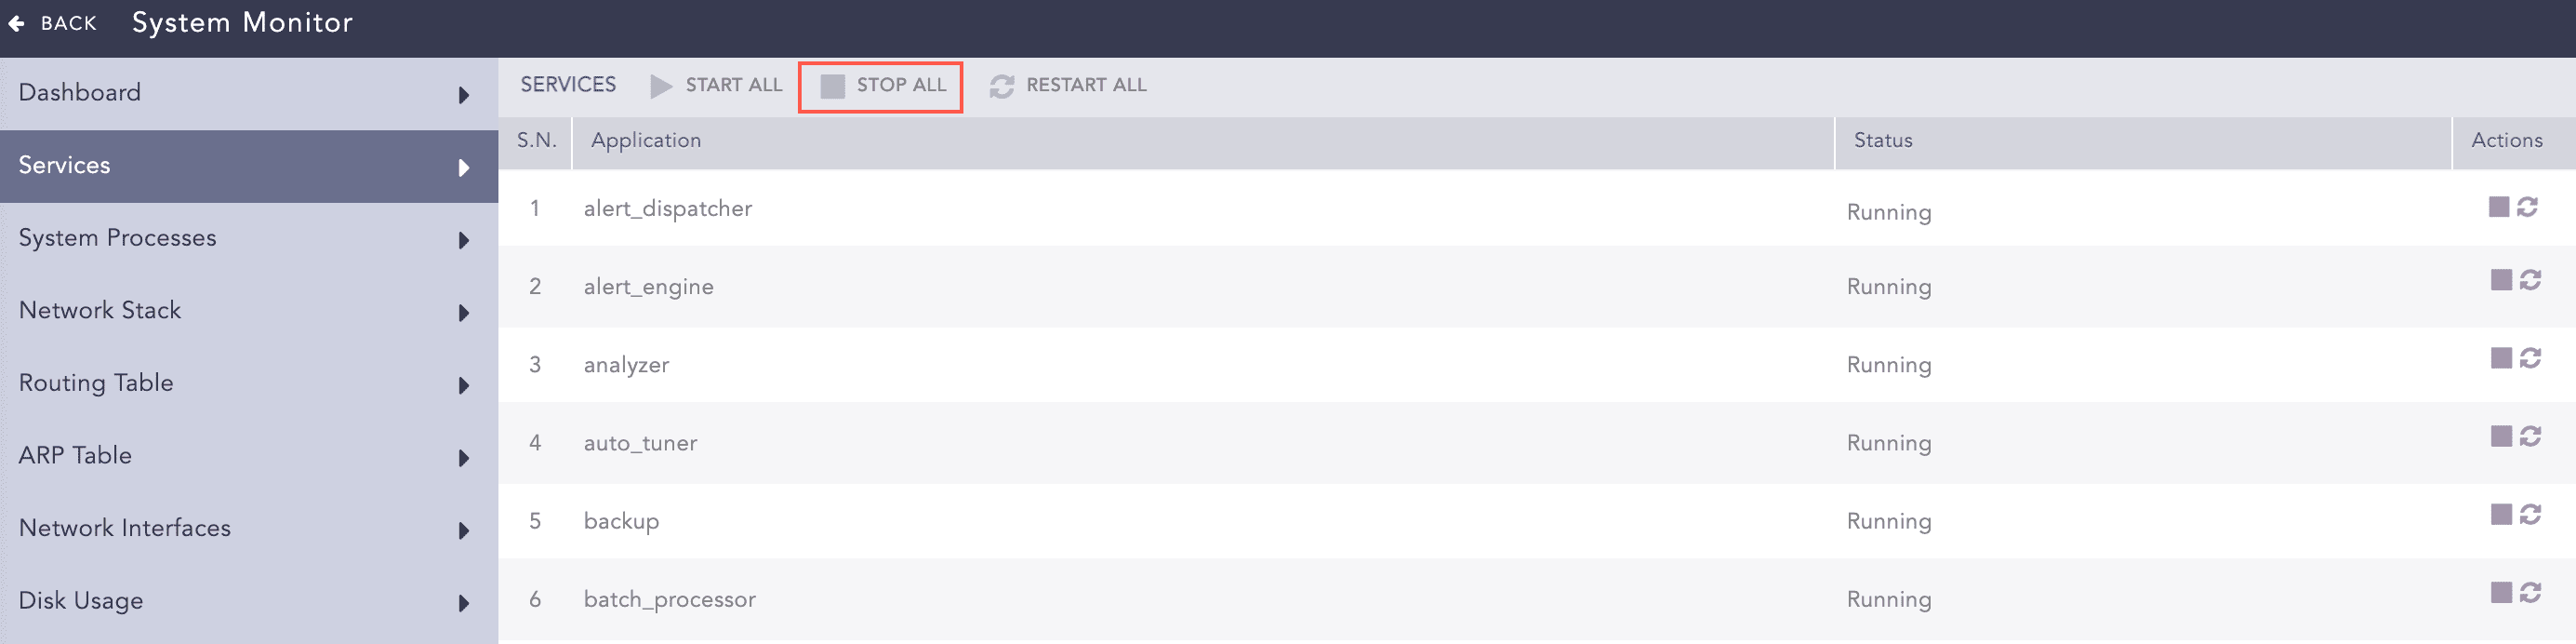
Stopping Services
To stop a service, click the Stop Service icon from the Actions column of the service.
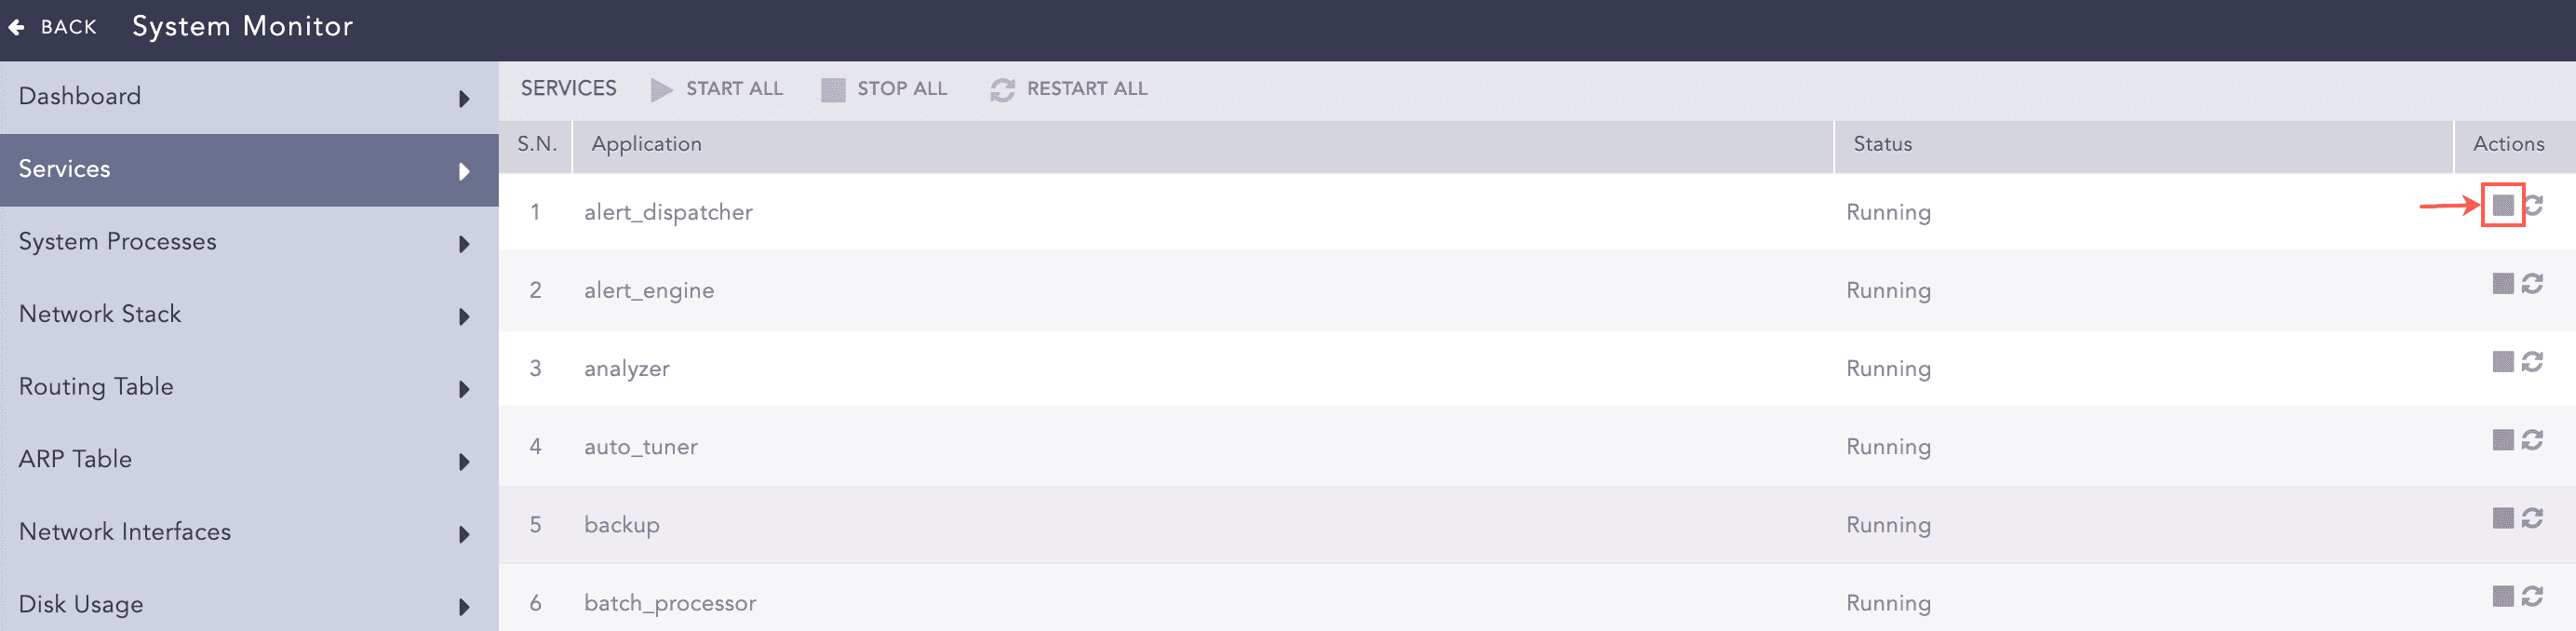
Services
To stop all the services, click Stop All.
Services
Restarting Services
To restart a service, click the Restart Service icon from the Actions column of the service.
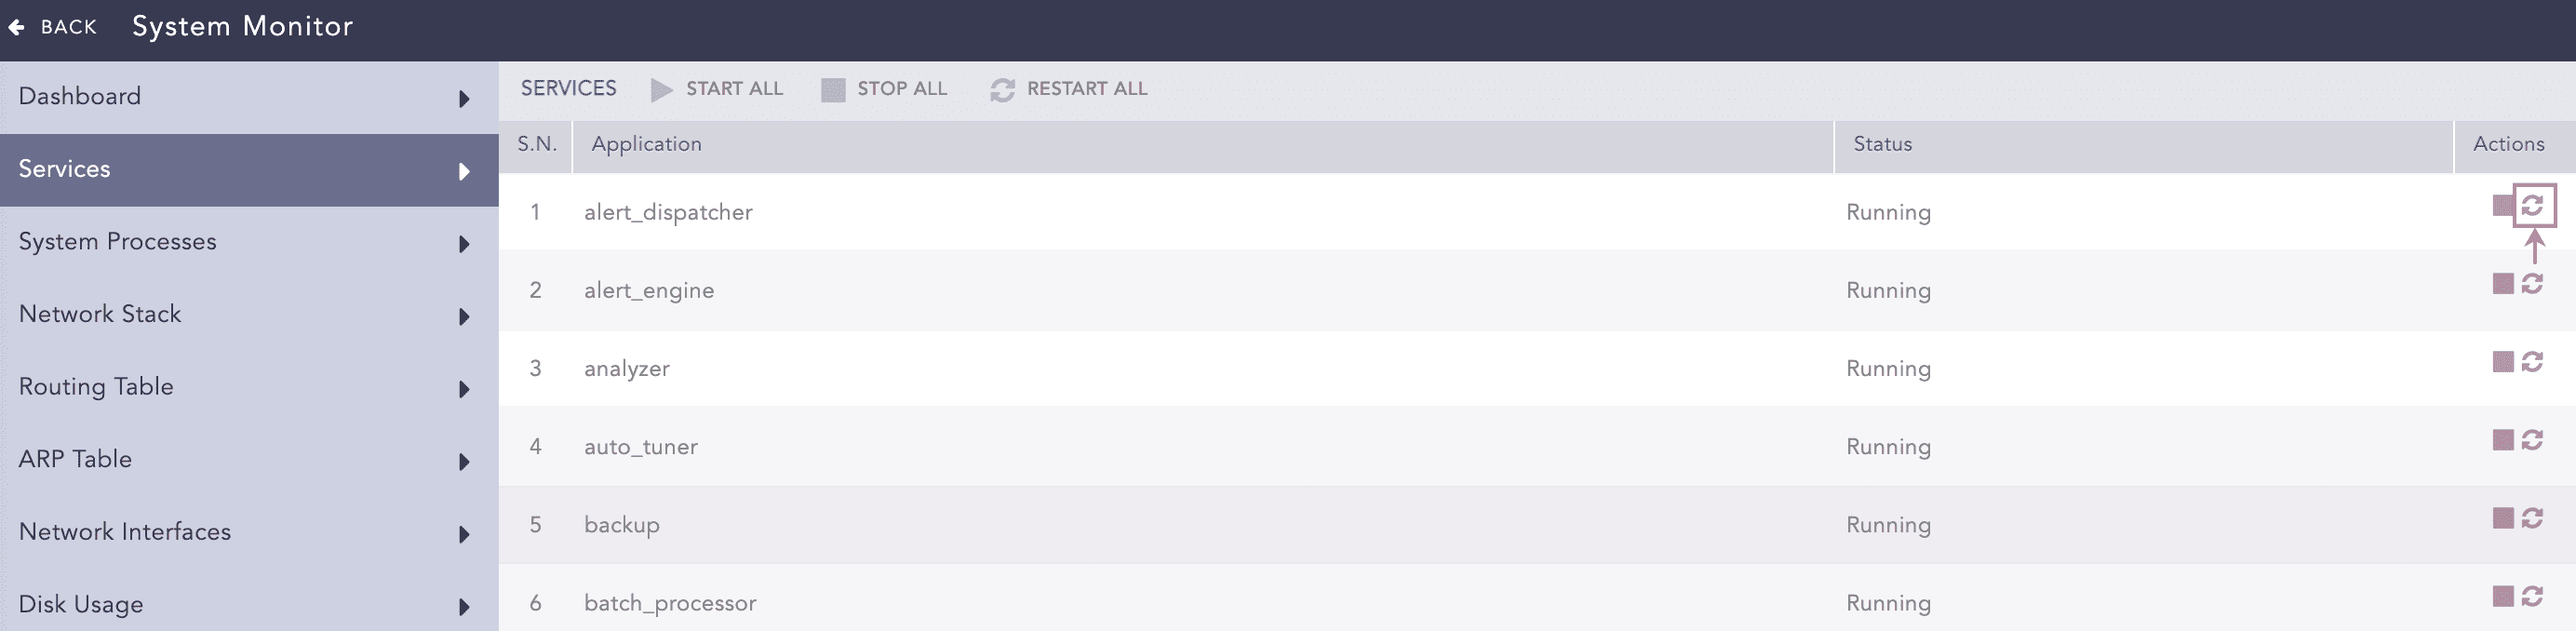
Services
To restart all the services, click Restart All.
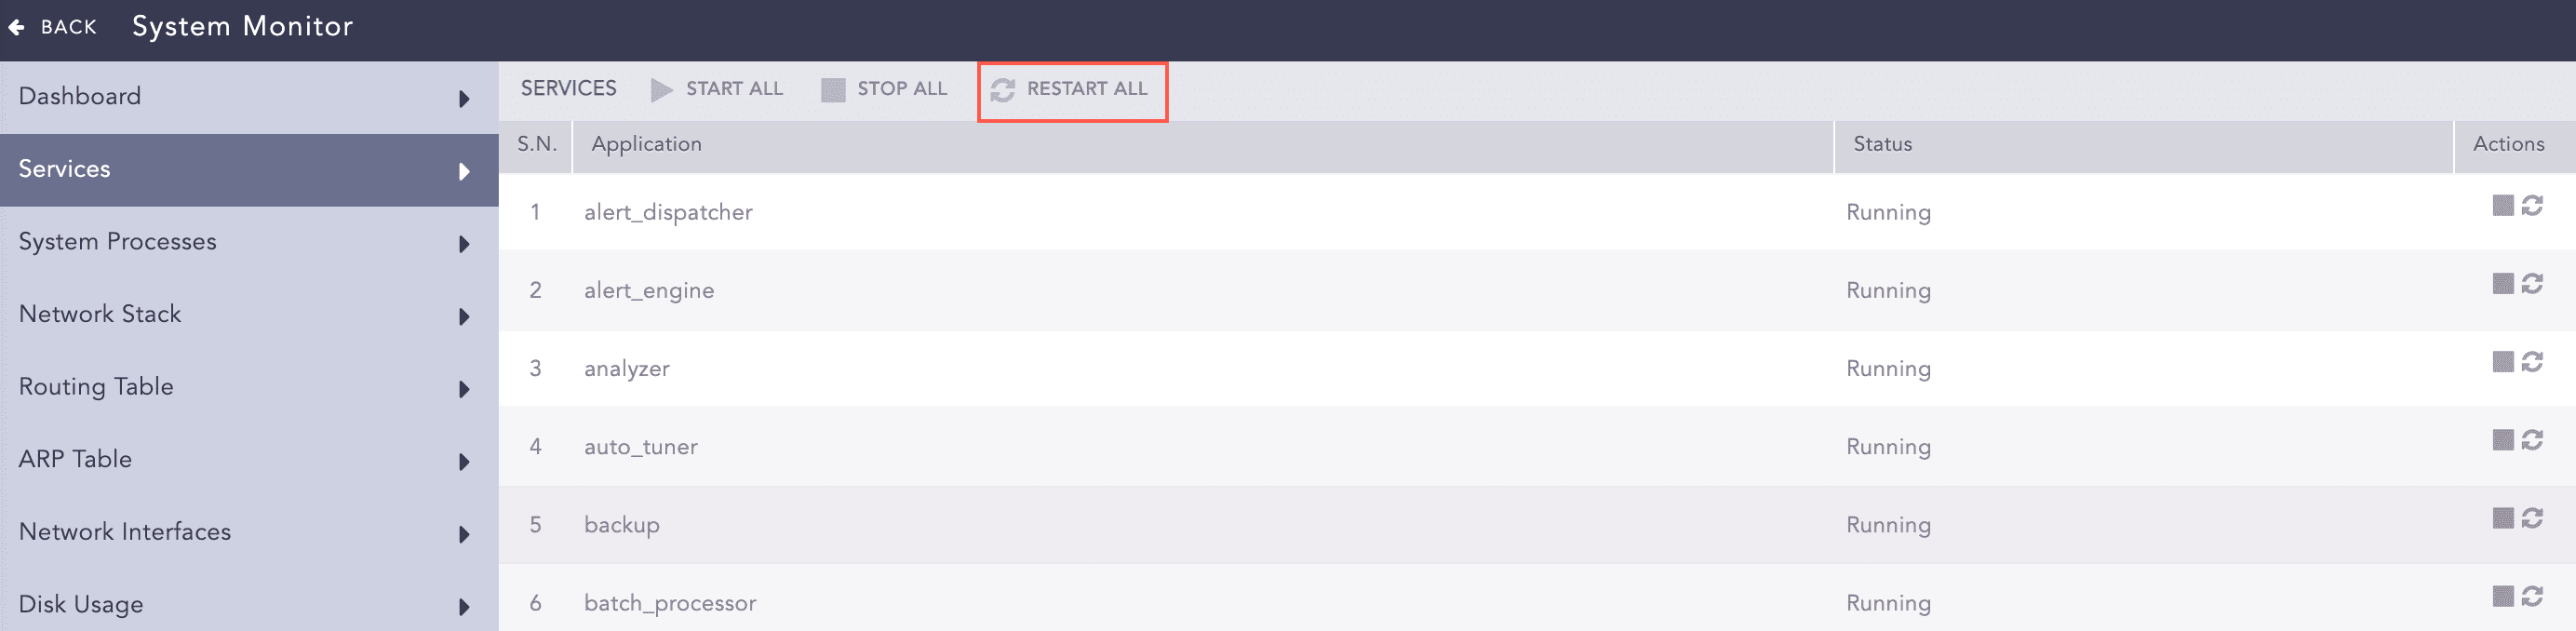
Services
It shows all the processes running on the operating system on which LogPoint is installed. You can view the process list showing users, memory used by processes, commands on run, and process ids.
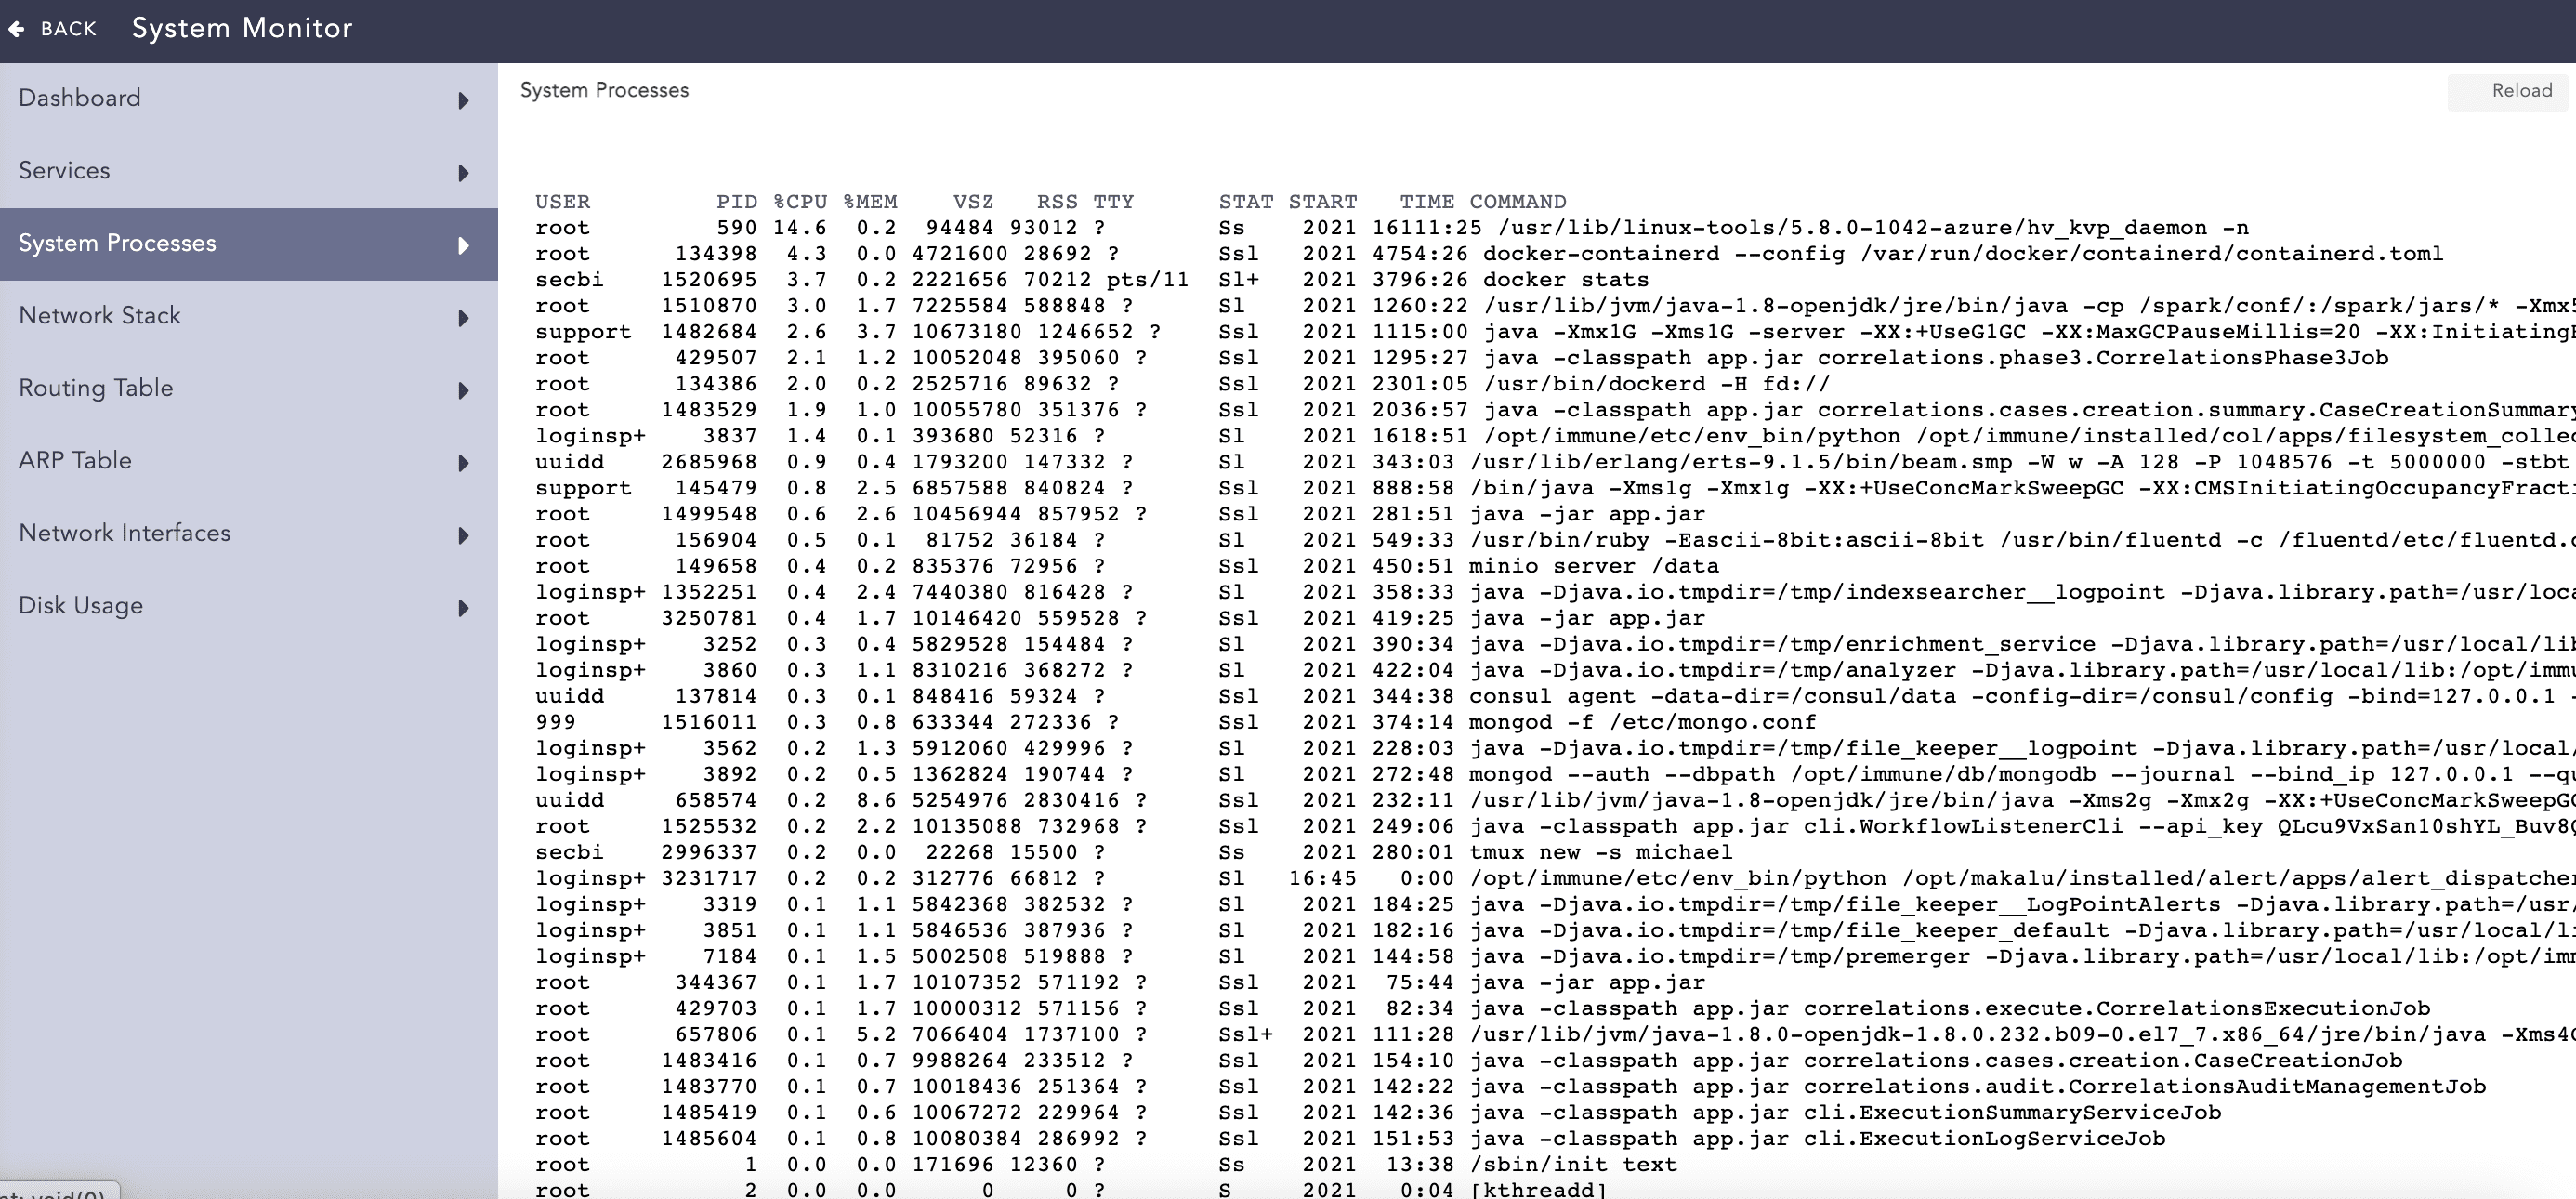
System Processes
You can reload the page by clicking Reload.
The Network Stacks are used in communication networks.
Displays the routes to particular network destinations.
A protocol for mapping an Internet Protocol address (IP address) to a physical machine address that is recognized in the local network. This item data lists all the connection status under this protocol.
Displays the network status of the LogPoint. This tool shows the state of all the active interfaces such as eth0, l0, he-ipv6, tun0, tun1, and tun10000.
Displays the total disk usage by LogPoint file systems. It illustrates the available disk space, disk usage, and location of the file system. LogPoint generates disk notifications once when the disk usage reaches 80%, and again when the disk usage reaches 90%.
When the available disk space is less than 2 GB, LogPoint stops collecting or fetching any logs and resumes only when at least 4 GB of space is available. Similarly, if the available space for a partition containing a repo path is less than 250 MB, LogPoint stops storing log messages in that partition and generates an audit log specifying that there is insufficient disk space available to store logs. LogPoint resumes data storage when enough space is available.
In addition to the LogPoint UI, you can also monitor the status of your LogPoint using SNMP walk. Use the base OID 1.3.6.1.4.1.54322.1 with the provided community string to get a list of all the exposed OIDs and the corresponding information.
Note
You can also use enterprises.54322.1 as the base OID.
An MIB file with the OIDs is on the Help Center.
Syntax to monitor LogPoint using SNMP walk:
snmpwalk -v2c -c <Community String> <IP address of LogPoint>:161 <OID>
The following OIDs are exposed by LogPoint:
SN |
OID |
Information |
|---|---|---|
1 |
1.3.6.1.4.1.54322.1.1 |
Last recorded messages per second in the normalizer |
2 |
1.3.6.1.4.1.54322.1.2 |
Average messages per second in the last 5 minutes in the normalizer |
3 |
1.3.6.1.4.1.54322.1.3 |
Last recorded messages per second in the store handler |
4 |
1.3.6.1.4.1.54322.1.4 |
Average messages per second in the last 5 minutes in the store handler |
5 |
1.3.6.1.4.1.54322.1.5 |
Services that are currently down |
6 |
1.3.6.1.4.1.54322.1.6 |
LogPoint version |
7 |
1.3.6.1.4.1.54322.1.7 |
Status of the log collection services |
8 |
1.3.6.1.4.1.54322.1.7.1 |
CPU consumption in collection (in %) |
9 |
1.3.6.1.4.1.54322.1.7.2 |
Memory consumption in collection (in %) |
10 |
1.3.6.1.4.1.54322.1.7.3 |
Queue in collection (in MB) |
11 |
1.3.6.1.4.1.54322.1.8 |
Status of the normalization services |
12 |
1.3.6.1.4.1.54322.1.8.1 |
CPU consumption in normalization (in %) |
13 |
1.3.6.1.4.1.54322.1.8.2 |
Memory consumption in normalization (in %) |
14 |
1.3.6.1.4.1.54322.1.8.3 |
Queue in normalization (in MB) |
15 |
1.3.6.1.4.1.54322.1.9 |
Status of enrichment services |
16 |
1.3.6.1.4.1.54322.1.9.1 |
CPU consumption in enrichment (in %) |
17 |
1.3.6.1.4.1.54322.1.9.2 |
Memory consumption in enrichment (in %) |
18 |
1.3.6.1.4.1.54322.1.9.3 |
Queue in enrichment (in MB) |
19 |
1.3.6.1.4.1.54322.1.10 |
Status of indexing services |
20 |
1.3.6.1.4.1.54322.1.10.1 |
CPU consumption in indexing (in %) |
21 |
1.3.6.1.4.1.54322.1.10.2 |
Memory consumption in indexing (in %) |
22 |
1.3.6.1.4.1.54322.1.10.3 |
Queue in indexing (in MB) |
23 |
1.3.6.1.4.1.54322.1.11 |
Status of the dashboard and alerting service |
24 |
1.3.6.1.4.1.54322.1.11.1 |
CPU consumption for dashboards and alerts (in %) |
25 |
1.3.6.1.4.1.54322.1.11.2 |
Memory consumption for dashboards and alerts (in %) |
26 |
1.3.6.1.4.1.54322.1.11.4 |
Disk usage by dashboards and alerts |
27 |
1.3.6.1.4.1.54322.1.11.5 |
Number of active search processes (live searches) |
28 |
1.3.6.1.4.1.54322.1.12 |
ZFS pool statistics |
29 |
1.3.6.1.4.1.54322.1.12.1 |
Names of the ZFS pools |
30 |
1.3.6.1.4.1.54322.1.12.2 |
Status of the ZFS pools |
31 |
1.3.6.1.4.1.54322.1.12.3 |
Disk allocation for the ZFS pools |
32 |
1.3.6.1.4.1.54322.1.12.4 |
Free disk space in the ZFS pools |
33 |
1.3.6.1.4.1.54322.1.12.5 |
Read operations in the ZFS pools |
34 |
1.3.6.1.4.1.54322.1.12.6 |
Write operations in the ZFS pools |
35 |
1.3.6.1.4.1.54322.1.12.7 |
Read bandwidth in the ZFS pools |
36 |
1.3.6.1.4.1.54322.1.12.8 |
Write bandwidth in the ZFS pools |
37 |
1.3.6.1.4.1.54322.1.12.9 |
Failed disks in the pools (if any) |
38 |
1.3.6.1.4.1.54322.1.13 |
Statistics for the log size in repos |
39 |
1.3.6.1.4.1.54322.1.13.1 |
Names of the repos |
40 |
1.3.6.1.4.1.54322.1.13.2 |
Log size of repos in the previous day |
41 |
1.3.6.1.4.1.54322.1.13.3 |
Log size of repos in the previous month |
42 |
1.3.6.1.4.1.54322.1.14 |
Status of LUNs in systems with multipath devices |
43 |
1.3.6.1.4.1.54322.1.14.1 |
Name of the multipath |
44 |
1.3.6.1.4.1.54322.1.14.2 |
UUID of the multipath |
45 |
1.3.6.1.4.1.54322.1.14.3 |
SysFS device-mapper’s blocked device name of the multipath |
46 |
1.3.6.1.4.1.54322.1.14.4 |
Device vendor/product/revision information |
47 |
1.3.6.1.4.1.54322.1.14.5 |
Total number of detected paths of the multipath |
48 |
1.3.6.1.4.1.54322.1.14.6 |
Total active paths of the multipath |
49 |
1.3.6.1.4.1.54322.1.14.7 |
Product information |
50 |
1.3.6.1.4.1.54322.1.14.8 |
Status of the multipath |
51 |
1.3.6.1.4.1.54322.1.14.9 |
Size of the multipath |
52 |
1.3.6.1.4.1.54322.1.14.10 |
Automatic failback configuration of the multipath |
53 |
1.3.6.1.4.1.54322.1.30 |
Status of the LogPoint Collector buffer |
54 |
1.3.6.1.4.1.54322.1.30.1 |
The logs in the buffer not received by the main LogPoint |
55 |
1.3.6.1.4.1.54322.1.30.2 |
The time (in seconds) since the last message was received by the main LogPoint |
Note
The OIDs for ZFS pool statistics, statistics for the log size in repos, and LUN status provide information for all these entities. To retrieve the information for a single one, add an extra number corresponding to the respective pool, repo, or LUN after the provided OID.
For example, you can use enterprises.54322.1.12.1 to retrieve the names of all the ZFS pools and enterprises.54322.1.12.1.1 to retrieve the name of the first ZFS pool.
Additionally, you can use the following default OIDs for a Linux-based system:
General Statistics
SN |
OID |
Information |
|---|---|---|
1 |
1.3.6.1.4.1.2021.11 |
CPU and swap information |
2 |
1.3.6.1.2.1.2.2.1 |
Network interfaces information |
3 |
1.3.6.1.2.1.25.2.3.1.6.2 |
Disk usage information |
4 |
1.3.6.1.2.1.25.1.1.0 |
Uptime information |
CPU load
SN |
OID |
Information |
|---|---|---|
1 |
1.3.6.1.4.1.2021.10.1.3.1 |
CPU load over the last minute |
2 |
1.3.6.1.4.1.2021.10.1.3.2 |
CPU load over the last 5 minutes |
3 |
1.3.6.1.4.1.2021.10.1.3.3 |
CPU load over the last 15 minutes |
4 |
1.3.6.1.4.1.2021.11.9.0 |
Percentage of CPU time consumed by user |
5 |
1.3.6.1.4.1.2021.11.50.0 |
Raw CPU time consumed by user |
6 |
1.3.6.1.4.1.2021.11.10.0 |
Percentage of CPU time used by system |
7 |
1.3.6.1.4.1.2021.11.52.0 |
Raw CPU time used by system |
8 |
1.3.6.1.4.1.2021.11.11.0 |
Percentage of idle CPU time |
9 |
1.3.6.1.4.1.2021.11.53.0 |
Raw idle CPU time |
10 |
1.3.6.1.4.1.2021.11.51.0 |
Raw nice CPU time |
Memory statistics
SN |
OID |
Information |
|---|---|---|
1 |
1.3.6.1.4.1.2021.4.3.0 |
Total swap size |
2 |
1.3.6.1.4.1.2021.4.4.0 |
Available swap space |
3 |
1.3.6.1.4.1.2021.4.5.0 |
Total RAM in the machine |
4 |
1.3.6.1.4.1.2021.4.6.0 |
Total RAM used |
5 |
1.3.6.1.4.1.2021.4.11.0 |
Total free RAM |
6 |
1.3.6.1.4.1.2021.4.13.0 |
Total shared RAM |
7 |
1.3.6.1.4.1.2021.4.14.0 |
Total RAM buffered |
8 |
1.3.6.1.4.1.2021.4.15.0 |
Total cached memory |
Disk statistics
SN |
OID |
Information |
|---|---|---|
1 |
1.3.6.1.4.1.2021.9.1.6.1 |
Total size of the disk or partition (in KB) |
2 |
1.3.6.1.4.1.2021.9.1.7.1 |
Available space on the disk |
3 |
1.3.6.1.4.1.2021.9.1.8.1 |
Used space on the disk |
4 |
1.3.6.1.4.1.2021.9.1.9.1 |
Percentage of used space on the disk |
5 |
1.3.6.1.4.1.2021.9.1.10.1 |
Percentage of inodes used on the disk |
6 |
1.3.6.1.2.1.1.3.0 |
System uptime |